Embarking on your cryptocurrency journey can feel like navigating a complex new digital frontier. For beginners, the volatility and jargon can be overwhelming. However, understanding the market is the key to unlocking its potential. This guide is designed to simplify that process, providing a deep dive into Axiom trading and how you can leverage its tools for insightful analysis and trend prediction. We will break down complex concepts into easy-to-understand steps, empowering you to make more informed decisions from your very first trade. At Axiom, we believe that with the right platform and knowledge, anyone can approach the crypto market with confidence.
What is the Axiom Trading Platform?
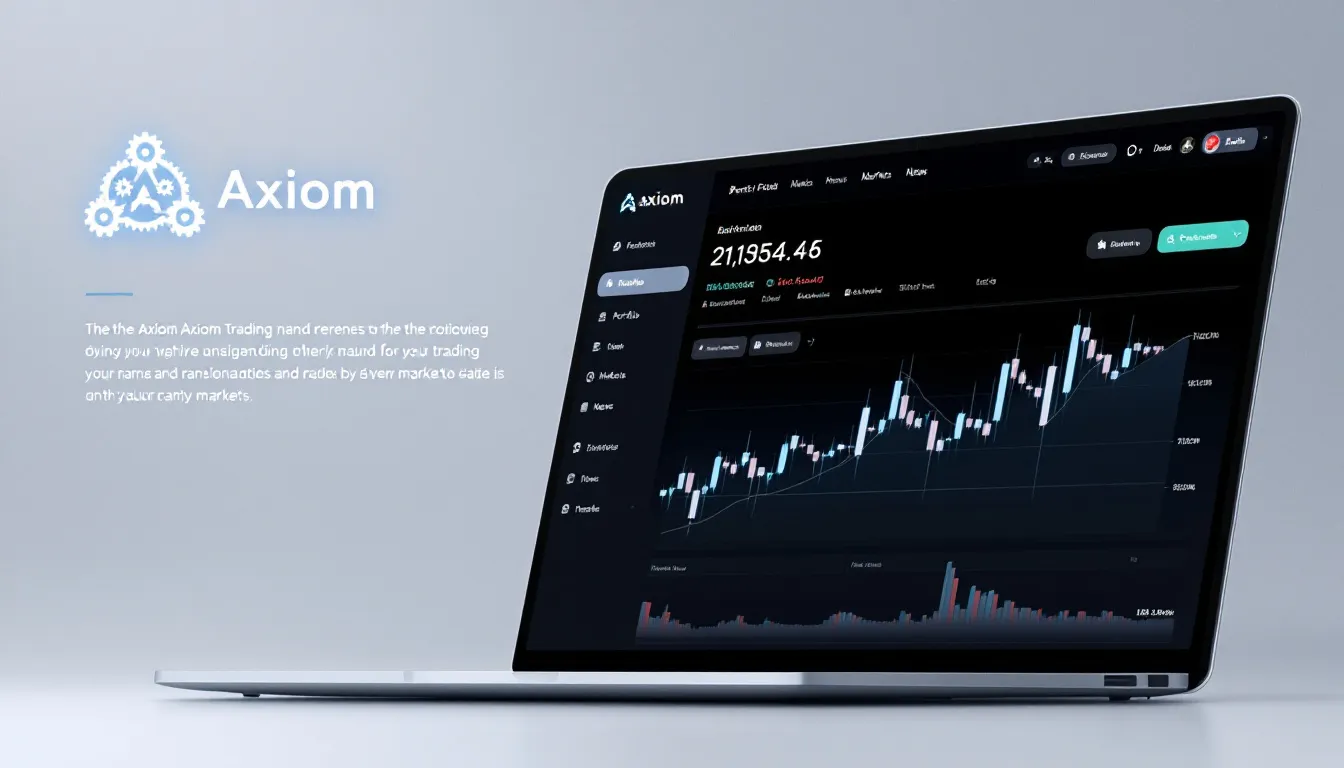
Platform Overview
Before we delve into market analysis, let’s clarify what Axiom is. Axiom.trade is a cutting-edge trading environment designed for both new and experienced traders. The Axiom trading platform provides users with a comprehensive suite of tools, real-time data, and access to a wide variety of digital assets. Its mission is to democratize access to financial markets by combining a user-friendly interface with powerful analytical capabilities.
For a crypto newbie, this means you get a platform that grows with you. You can start with the basics and gradually explore more advanced features as your skills and confidence improve. Think of it as your all-in-one hub for learning, analyzing, and executing trades in the dynamic world of cryptocurrency.
Why Market Analysis is Crucial for Crypto Newbies
You might ask, “Why do I need analysis? Can’t I just buy a popular coin and wait?” While that strategy might occasionally work through sheer luck, it’s not sustainable. The crypto market is famously volatile. Prices can swing dramatically based on news, technology updates, or shifts in market sentiment.
Here’s why analysis is your best friend:
- Informed Decision-Making: Analysis helps you move beyond hype and speculation. You learn to evaluate a project’s intrinsic value and market position.
- Risk Management: By understanding trends and identifying potential price levels, you can better manage your risk, setting strategic entry and exit points.
- Identifying Opportunities: A trained eye can spot emerging trends and undervalued assets before they become mainstream, offering significant growth potential.
- Building Confidence: The more you understand why the market is moving, the less intimidating it becomes. This knowledge builds the confidence needed to trade calmly and rationally.
According to a report from Chainalysis, while large institutional transactions dominate trading volume, the largest number of individual transfers are retail-sized, indicating a massive global community of individual traders.
This highlights the importance for individuals like you to be well-equipped with analytical skills. For a great starting point, check out our homepage to see our core offerings.
The Two Core Pillars of Crypto Analysis
Market analysis primarily falls into two categories: Fundamental Analysis (FA) and Technical Analysis (TA). A successful trader often uses a blend of both. Let’s break them down.
Fundamental Analysis (FA): Assessing a Crypto’s Intrinsic Value
Fundamental Analysis is like being a detective. You’re looking for clues about a cryptocurrency’s long-term potential and intrinsic value. You’re asking the question: “Does this project have real-world utility and a sustainable future?”
Key areas to investigate include:
- The Whitepaper: This is the project’s founding document. It outlines the problem it aims to solve, its technology, and its roadmap. Is the goal clear and achievable?
- The Team: Who are the developers and leaders behind the project? Do they have a proven track record in technology or business?
- Tokenomics: This refers to the economics of the coin. How many coins will ever exist (total supply)? How are new coins created and distributed? A limited supply, like Bitcoin’s 21 million, can create scarcity and drive value.
- Community and Adoption: A strong, active community and growing real-world adoption are powerful indicators of a project’s health.
Technical Analysis (TA): Using Charts to Predict Price Movements
If FA is about a project’s long-term health, Technical Analysis is about its short-to-medium-term price action. TA practitioners believe that all known information is already reflected in the price, and that historical price movements can predict future behavior.
This is where the Axiom trading platform truly shines, providing you with all the necessary tools. To get started, you don’t need to be a math genius. You just need to understand a few core concepts. If you wish to learn more, you can take a deep dive into technical analysis on our dedicated page.
Key TA tools include:
- Candlestick Charts: These show the open, high, low, and close prices for a specific period. Patterns in these candles can signal potential market reversals or continuations.
- Support and Resistance: These are key price levels where the price has historically struggled to break below (support) or above (resistance).
- Moving Averages (MA): These smooth out price data to show the underlying trend direction. A common strategy is to watch for when a short-term MA crosses a long-term MA.
- Relative Strength Index (RSI): This is a momentum indicator that measures the speed and change of price movements. It helps identify “overbought” (RSI > 70) or “oversold” (RSI < 70) conditions. Investopedia provides a great explanation of the RSI and its calculations.
Getting Started with Axiom Pro Trading Analysis
Now, let’s put theory into practice. The Axiom Pro Trading experience is designed to make analysis accessible. Here’s a simplified workflow you can follow as a beginner.
-
Step 1: Choose Your Asset
Start with a well-known cryptocurrency like Bitcoin (BTC) or Ethereum (ETH). Their extensive price history and vast amount of available information make them ideal for learning analysis. Axiom offers a broad range of crypto trading options for you to explore as you grow.
-
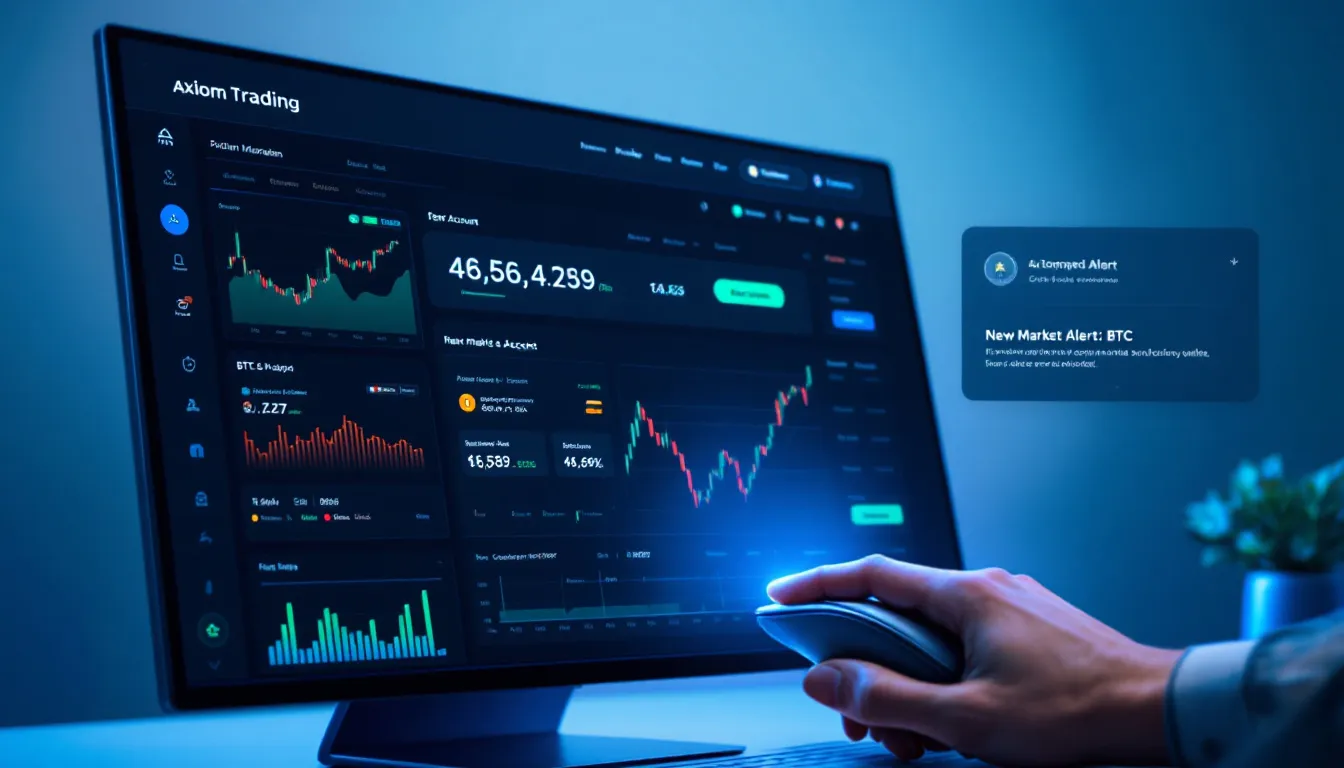
Step 2: Open the Chart
On the Axiom platform, open the full chart for your chosen asset. Set the timeframe to a longer period, like the daily (1D) chart, to get a sense of the overall trend. Is the price generally moving up, down, or sideways?
-
Step 3: Apply Basic Indicators
You don’t need a cluttered chart. Start with two simple but powerful indicators available on the Axiom interface: a 50-day Simple Moving Average (SMA) to gauge the trend, and the Relative Strength Index (RSI) to check for overbought/oversold conditions.
-
Step 4: Identify Key Levels
Look at the chart’s history. Draw horizontal lines at price levels where the asset has peaked and bottomed out multiple times. These are your resistance and support levels. They act as potential turning points for the price. This entire process is made easier by following this guide and applying it directly on our platform.
-
Step 5: Synthesize and Act
Now, combine your findings. If the price is in an uptrend (above the 50 SMA), approaching a historical support level, and the RSI is showing oversold, it could signal a strong buying opportunity. Conversely, if the price is in a downtrend and approaching resistance with an overbought RSI, it might be wise to be cautious.
Ready to Try Your First Analysis?
The Axiom trading platform is built for this. Get hands-on experience with professional tools in a user-friendly environment.
Sign Up and Access Your Trading Tools NowUnderstanding Trading Costs: A Look at Axiom Exchange Fees
A crucial part of successful trading is managing your costs. High fees can eat into your profits, especially for active traders. It’s vital to understand the fee structure of any exchange you use. We are committed to transparency regarding the Axiom exchange fees. Our goal is to provide a competitive and clear fee structure, ensuring you can trade with confidence and without hidden charges. Before executing a trade, you can always review the associated costs, allowing for better financial planning and strategy execution.
Analyzing and Predicting Major Crypto Trends for 2025
Understanding broad market trends provides the context for your individual asset analysis. Here are some key trends to watch.
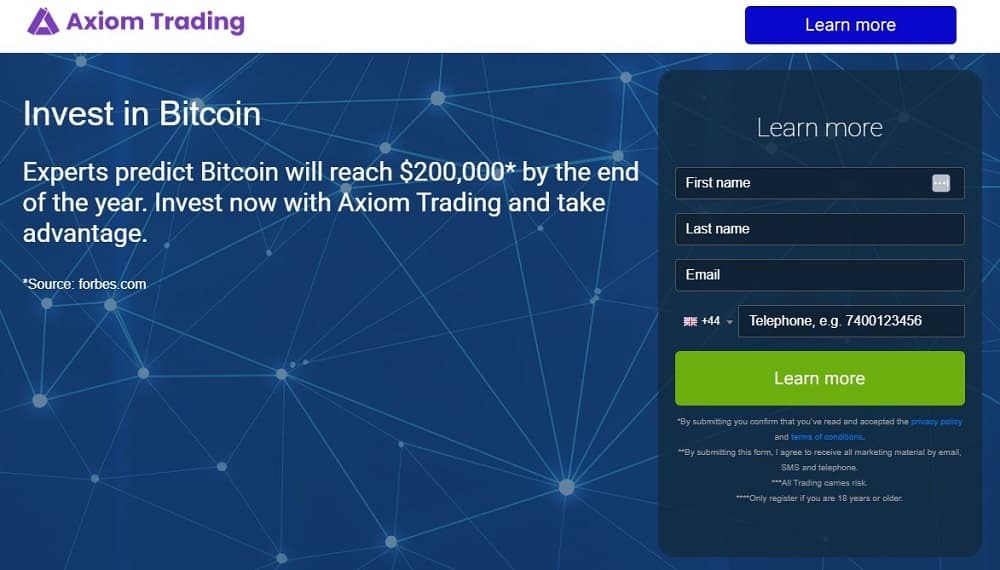
The Bitcoin Halving Echo
Bitcoin undergoes a “halving” approximately every four years, where the reward for mining new blocks is cut in half. Historically, the 12-18 months following a halving have been characterized by significant bull runs. The most recent halving occurred in April 2024, and its effects are expected to ripple through the market into 2025. This scarcity-driving event often lifts the entire crypto market, not just Bitcoin.
The Rise of Layer-2 and Scalability Solutions
Blockchains like Ethereum can become slow and expensive during periods of high demand. Layer-2 solutions (L2s) are projects built on top of these main blockchains to make transactions faster and cheaper. The growth and adoption of L2s like Arbitrum, Optimism, and Polygon are a major trend, indicating the maturation of the industry towards real-world usability.
Regulation and Institutional Adoption
Governments worldwide are establishing clearer regulatory frameworks for crypto. While this can cause short-term volatility, it’s ultimately a bullish long-term signal as it paves the way for institutional investors. The approval of spot Bitcoin ETFs in the US was a landmark event. As more institutions like pension funds and corporations gain regulated access to crypto, it could bring trillions of dollars into the market. Major financial news outlets like Reuters frequently cover the evolving landscape of crypto regulation.

Common Mistakes to Avoid as a Crypto Newbie
Common Pitfalls
Knowledge of what not to do is just as important as knowing what to do. Avoid these common pitfalls:
- FOMO (Fear Of Missing Out): Never buy an asset simply because its price is skyrocketing. This is often when the risk is highest. Stick to your analysis.
- Ignoring Risk Management: Never invest more than you are willing to lose. Consider using stop-loss orders to automatically sell an asset if it drops to a certain price.
- Lack of Diversification: Putting all your funds into a single, obscure coin is extremely risky. A diversified portfolio across different types of crypto assets can mitigate risk.
- Emotional Trading: Fear and greed are your worst enemies. Create a trading plan based on your analysis and stick to it. Don’t let market noise dictate your actions.
The global crypto market capitalization has fluctuated wildly, reaching over $2 trillion at various peaks. This immense value underscores the opportunities but also the risks involved, making a disciplined approach essential.

The Future is with Axiom.trade
The cryptocurrency market is constantly evolving, and so is the Axiom.trade ecosystem. We are committed to continuously enhancing our platform, adding new tools, providing more educational resources, and expanding our list of tradable assets. For our advanced users, we are developing sophisticated features like the Axiom migration sniper to capitalize on specific market events. Our goal is to empower you not just for today’s market, but for the financial landscape of tomorrow.
By choosing Axiom trading, you are not just getting a platform; you are joining a community focused on providing the clarity and tools needed to navigate the exciting world of digital assets.
Key Takeaways
Navigating the crypto market as a beginner doesn’t have to be a gamble. By grounding your decisions in fundamental and technical analysis, you can transform speculation into a calculated strategy. We’ve covered the core principles of analysis, how to apply them, and the major trends shaping the market. The key takeaway is that with the right approach and powerful tools, anyone can participate intelligently.
Conclusion
The Axiom trading platform was built to be your partner on this journey, offering a robust, intuitive environment for analysis and execution. The next step is to put this knowledge into action.
Are you ready to start your trading journey with confidence?
Click Here to Sign Up for Axiom and Begin Trading Today!